Monitor your website speed using Pagespeed API and Google Sheets
Everyone loves speed - be it cars, superbikes, or websites. A good website (like this one 😉) loads content within the blink of an eye. A fast website can generate a lot of traffic easily. Users feel energetic and comfortable in using a website that responds quickly to their inputs. To measure the speed and performance, you need to be introduced to PageSpeed.
PageSpeed ⚡️
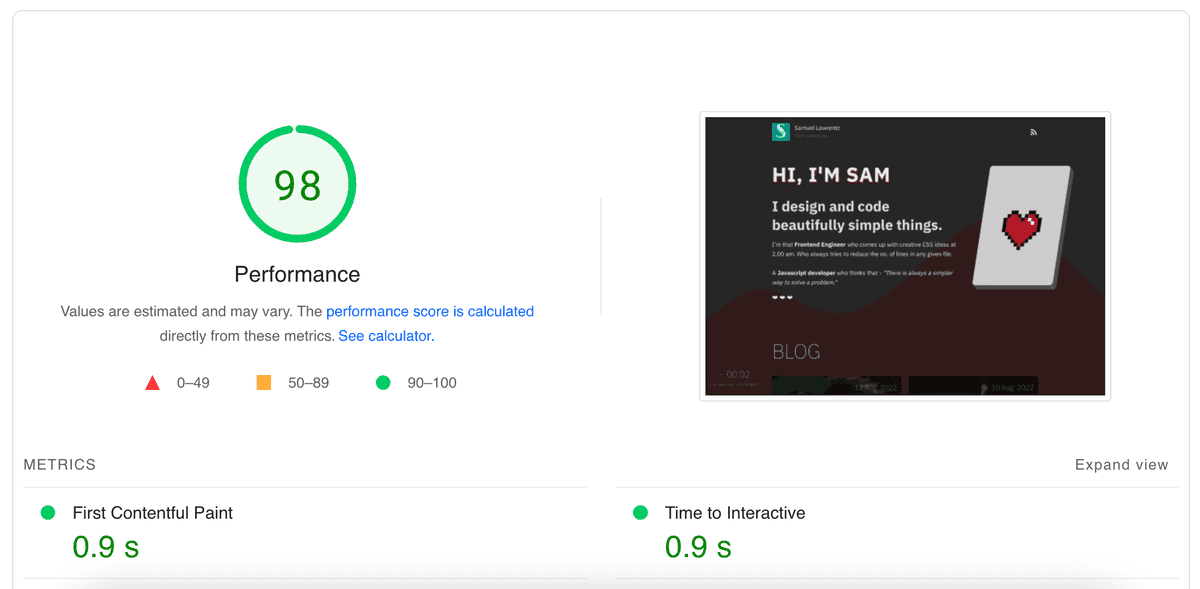
PageSpeed Insights is a google metric that helps developers and businesses to find out how their website performs and loads on different devices and conditions. A good website must have a PageSpeed above 90, where 100 is the best. For example, my website's pagespeed is almost 95-98, you can check it out here.
The PageSpeed of this website is almost 95-98. I'm planning to make it 100 soon, stay tuned.

You can get the speed insights of your website here - Google PageSpeed Insigts
PageSpeed API
This API is provided by google so that you can fetch your PageSpeed scores programmatically using the API. To get started, you have to create a google project and enable API usage. You will get an API Key. This is required to make API calls to the google PageSpeed server. Google has a free tier so cost shouldn't be a concern.
Google Sheets Apps Script
Google sheet has a section that allows you to write scripts that can be triggered automatically. The syntax looks like plain Javascript, but its called Apps Script or Google Script. You can find it in Extensions > Apps Script. For tips and tricks about coding standards, you can refer to this post.
Ok fine, How do we do the monitoring part?
You can make an API call to fetch the PageSpeed data and then write it to the last row in the sheet once everyday. In this manner, we can have a track of daily PageSpeed data and it can be used for further analytics. To understand the importance of analytics, you can refer to my post on Gatsby incremental faster builds with Github actions.
You can even set up a mail alert if the PageSpeed goes than, say 80 (I'm leaving it upto you, my fellow developer). The AppsScript code is as follows, put it in the Code.gs file in the script editor.
// Code.gs

// You can insert all the pages that you want to monitor into this array.
var urls = ['www.samuellawrentz.com'];
var lastRow = 0;

function initialize(){
  lastRow = SpreadsheetApp.getActiveSpreadsheet().getActiveSheet().getLastRow() + 1;
  var dateCell = SpreadsheetApp.getActiveSpreadsheet().getActiveSheet().getRange(lastRow, 1);

  // Set the date on the first column
  dateCell.setValue(new Date()).setNumberFormat("dd/MM/yyyy");
  urls.forEach(function(item, index){
  myFunction(item, index)
});
}


function myFunction(url, index) {
  var url = 'https://www.googleapis.com/pagespeedonline/v5/runPagespeed?url=https%3A%2F%2F'+ encodeURIComponent(url)+'&category=performance&key=YOUR_API_KEY_GOES_HERE';
  var options = {
    'method': 'get'
  };
  var response = UrlFetchApp.fetch(url, options);
  addData(response, index);
}

// Write the data to the next row to the last filled row
function addData(response, index) {
  var res = JSON.parse(response.getContentText());
  var cell = SpreadsheetApp.getActiveSpreadsheet().getActiveSheet().getRange(lastRow, index + 2);
  cell.setValue(res.lighthouseResult.categories.performance.score * 100);

}
Set up a trigger (can be found on the left side bar of the editor) that fires every day at midnight. You can see this script doing its work automatically every night for you. You can look at my google sheet for reference - https://docs.google.com/spreadsheets/d/15O2yPtvmFZvEEaxoZqpR-LksZ7CQR9SJjC5WETNgtaU/edit?usp=sharing
As you can see, I started the script recently. I'm planning to use the data for further analysis and produce historical charts later down the road. If you wanna know my journey to start this blog read - "How I started a tech blog?"
⚡️⚡️⚡️
